FunkLoad bench report
| Date: | 2013-07-05 09:23:28 |
|---|
Abstract
A demo for PyCon AU Bench result of StressTest.test_storage: No test description
Table of contents
1 Bench configuration
- Launched: 2013-07-05 09:23:28
- From: durian
- Test: stress.py StressTest.test_storage
- Target server: http://pyconau.services.mozilla.com/
- Cycles of concurrent users: [10, 20, 30]
- Cycle duration: 60s
- Sleeptime between request: from 0.0s to 0.0s
- Sleeptime between test case: 0.0s
- Startup delay between thread: 0.0s
- Apdex: 1.5
- FunkLoad version: 1.17.0
2 Bench content
The test StressTest.test_storage contains:
- 2 page(s)
- 0 redirect(s)
- 0 link(s)
- 0 image(s)
- 0 XML RPC call(s)
The bench contains:
- 1003 tests
- 2034 pages
- 2034 requests
3 Test stats
The number of Successful Tests Per Second (STPS) over Concurrent Users (CUs).
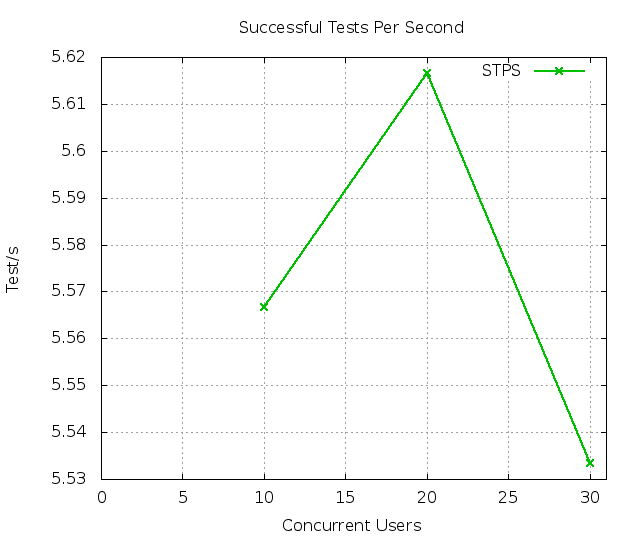
CUs STPS TOTAL SUCCESS ERROR 10 5.567 334 334 0.00% 20 5.617 337 337 0.00% 30 5.533 332 332 0.00%
4 Page stats
The number of Successful Pages Per Second (SPPS) over Concurrent Users (CUs). Note that an XML RPC call count like a page.
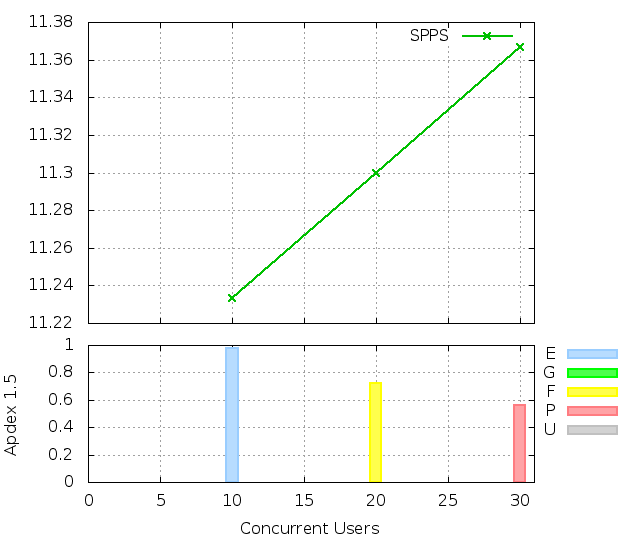
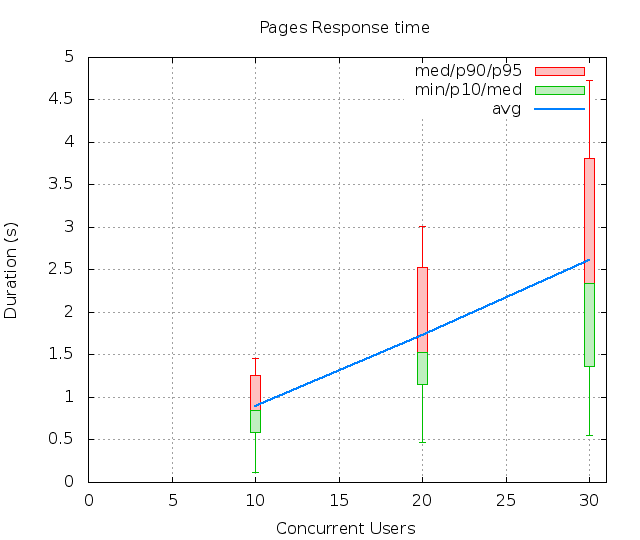
CUs Apdex* Rating SPPS maxSPPS TOTAL SUCCESS ERROR MIN AVG MAX P10 MED P90 P95 10 0.978 Excellent 11.233 16.000 674 674 0.00% 0.117 0.889 3.975 0.584 0.846 1.256 1.456 20 0.722 FAIR 11.300 20.000 678 678 0.00% 0.475 1.734 9.596 1.149 1.535 2.532 3.010 30 0.565 POOR 11.367 30.000 682 682 0.00% 0.558 2.607 20.525 1.367 2.336 3.813 4.728 * Apdex 1.5
5 Request stats
The number of Requests Per Second (RPS) successful or not over Concurrent Users (CUs).
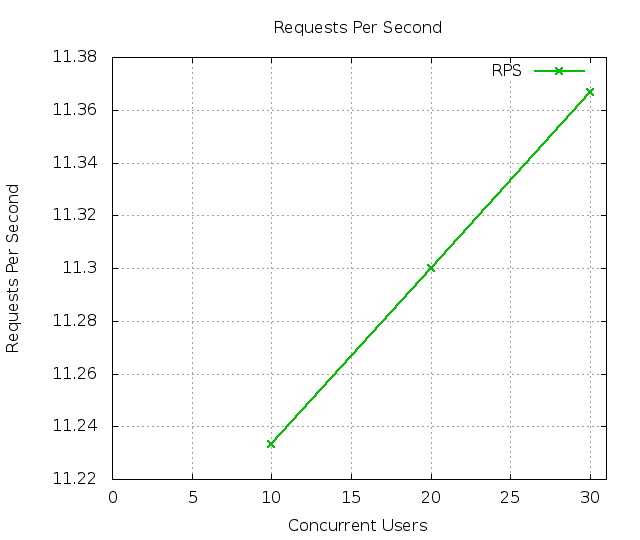
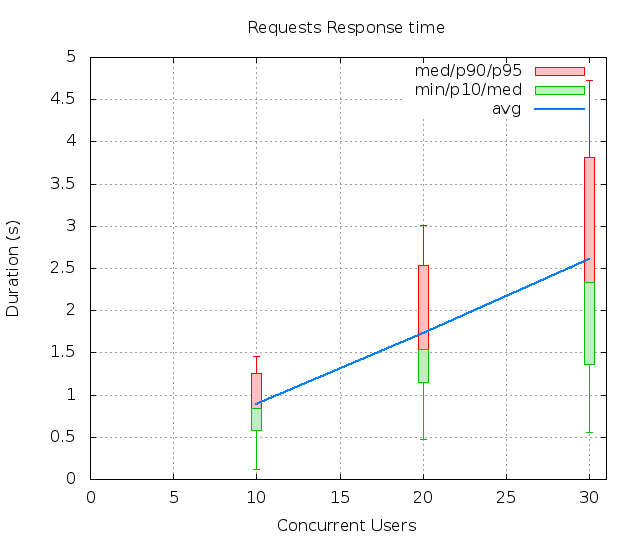
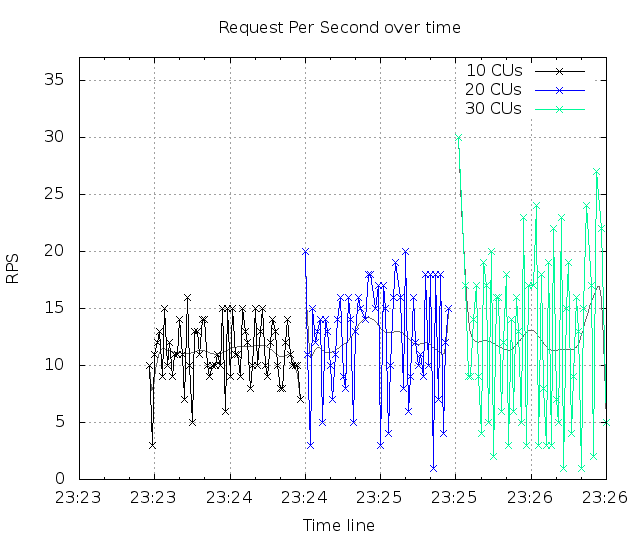
CUs Apdex* Rating* RPS maxRPS TOTAL SUCCESS ERROR MIN AVG MAX P10 MED P90 P95 10 0.978 Excellent 11.233 16.000 674 674 0.00% 0.117 0.889 3.975 0.584 0.846 1.256 1.456 20 0.722 FAIR 11.300 20.000 678 678 0.00% 0.475 1.734 9.596 1.149 1.535 2.532 3.010 30 0.565 POOR 11.367 30.000 682 682 0.00% 0.558 2.607 20.525 1.367 2.336 3.813 4.728 * Apdex 1.5
6 Slowest requests
The 5 slowest average response time during the best cycle with 10 CUs:
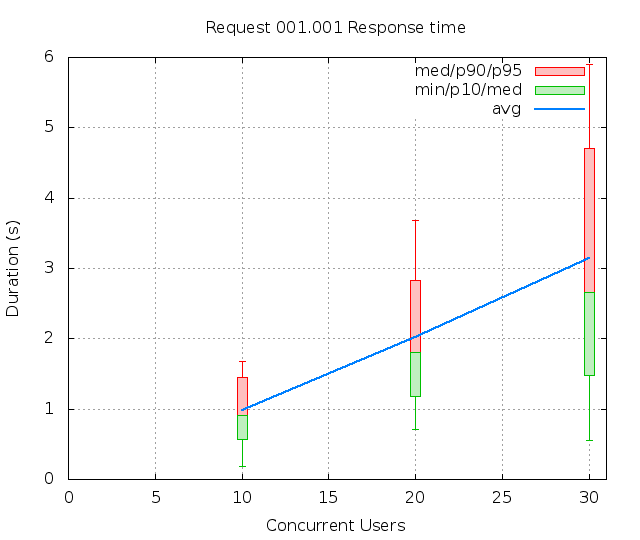
- In page 001, Apdex rating: Excellent, avg response time: 0.98s, get: //1.1/rfkelly/info/collections ``
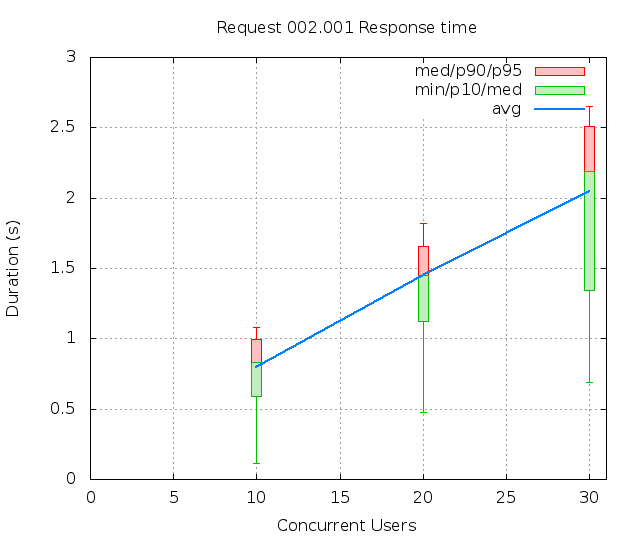
- In page 002, Apdex rating: Excellent, avg response time: 0.80s, get: //1.1/rfkelly/storage/bookmarks ``
7 Page detail stats
7.1 PAGE 001: //1.1/rfkelly/info/collections
Req: 001, get, url //1.1/rfkelly/info/collections
CUs
Apdex*
Rating
TOTAL
SUCCESS
ERROR
MIN
AVG
MAX
P10
MED
P90
P95
10
0.959
Excellent
340
340
0.00%
0.191
0.981
3.975
0.573
0.915
1.456
1.678
20
0.652
POOR
341
341
0.00%
0.709
2.014
9.596
1.187
1.802
2.831
3.677
30
0.539
POOR
350
350
0.00%
0.558
3.137
20.525
1.472
2.661
4.699
5.900
* Apdex 1.5
7.2 PAGE 002: //1.1/rfkelly/storage/bookmarks
Req: 001, get, url //1.1/rfkelly/storage/bookmarks
CUs
Apdex*
Rating
TOTAL
SUCCESS
ERROR
MIN
AVG
MAX
P10
MED
P90
P95
10
0.999
Excellent
334
334
0.00%
0.117
0.795
1.631
0.589
0.830
0.997
1.079
20
0.792
FAIR
337
337
0.00%
0.475
1.450
6.454
1.126
1.450
1.656
1.820
30
0.592
POOR
332
332
0.00%
0.692
2.049
5.651
1.344
2.192
2.510
2.650
* Apdex 1.5
8 Definitions
CUs: Concurrent users or number of concurrent threads executing tests.
Request: a single GET/POST/redirect/xmlrpc request.
Page: a request with redirects and resource links (image, css, js) for an html page.
STPS: Successful tests per second.
SPPS: Successful pages per second.
RPS: Requests per second, successful or not.
maxSPPS: Maximum SPPS during the cycle.
maxRPS: Maximum RPS during the cycle.
MIN: Minimum response time for a page or request.
AVG: Average response time for a page or request.
MAX: Maximmum response time for a page or request.
P10: 10th percentile, response time where 10 percent of pages or requests are delivered.
MED: Median or 50th percentile, response time where half of pages or requests are delivered.
P90: 90th percentile, response time where 90 percent of pages or requests are delivered.
P95: 95th percentile, response time where 95 percent of pages or requests are delivered.
Apdex T: Application Performance Index, this is a numerical measure of user satisfaction, it is based on three zones of application responsiveness:
Satisfied: The user is fully productive. This represents the time value (T seconds) below which users are not impeded by application response time.
Tolerating: The user notices performance lagging within responses greater than T, but continues the process.
Frustrated: Performance with a response time greater than 4*T seconds is unacceptable, and users may abandon the process.
By default T is set to 1.5s this means that response time between 0 and 1.5s the user is fully productive, between 1.5 and 6s the responsivness is tolerating and above 6s the user is frustrated.
The Apdex score converts many measurements into one number on a uniform scale of 0-to-1 (0 = no users satisfied, 1 = all users satisfied).
Visit http://www.apdex.org/ for more information.
Rating: To ease interpretation the Apdex score is also represented as a rating:
- U for UNACCEPTABLE represented in gray for a score between 0 and 0.5
- P for POOR represented in red for a score between 0.5 and 0.7
- F for FAIR represented in yellow for a score between 0.7 and 0.85
- G for Good represented in green for a score between 0.85 and 0.94
- E for Excellent represented in blue for a score between 0.94 and 1.
Report generated with FunkLoad 1.17.0, more information available on the FunkLoad site.